
Software for Polymer Testers
Software for Hardness Measurement EC 01
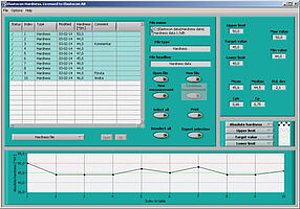
The EC 01 software for measurement of hardness can be connected to several hardness testers, e.g. from Wallace and Bareiss, for all Shore and IRHD scales.
Hardness Measurement and Monitoring
Measure and efficiently track hardness changes over time with our specialized software solution. The system automatically calculates the end of test periods based on the start date and duration, and provides optional printable reminders.
Key Features:
✅ Individual material profiles with defined limit and target values
✅ Automatic data storage per material, with new measurements added to existing profiles
✅ Real-time data acquisition from connected instruments
✅ Creation of trend diagrams including statistical analysis
✅ Printable results organized per material
Ensure precise monitoring of hardness and its changes with detailed documentation and intuitive trend visualizations.
Software for Measuring of Thickness EC 02
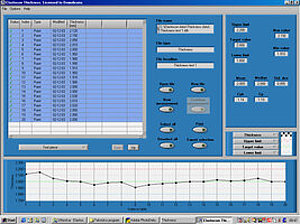
The EC 02 software for measuring of thickness can be connected to Mitutoyo gauges.
Thickness and Compression Set Measurement
This user-friendly software solution enables precise thickness measurements and calculations of compression set.
In compression set tests, the system automatically calculates the end time based on the start date and test duration, offering optional printable reminder notes.
Key Features:
✅ Creation of individual material profiles with defined limit and target values
✅ Automatic data storage per material, updating existing profiles with new measurements
✅ Real-time capture of measurement values from connected instruments
✅ Automatic generation of trend diagrams and statistical analyses
✅ Printable results clearly organized by material
The software ensures reliable and accurate monitoring of material thickness and compression set with detailed documentation and clear trend analysis.
Software for Balances EC 03
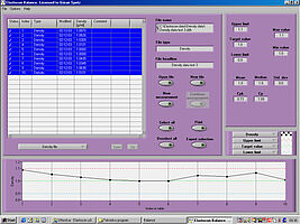
The EC 03 balances software can be connected to e.g. Kern and Sartorius balances, for measuring and calculating density, weight change and volume change.
Measurement of Weight and Volume Change
Efficiently measure and monitor weight and volume changes over time with our user-friendly software solution. The system automatically calculates test end times based on start date and test duration, providing optional printable reminders.
Key Features:
✅ Individual material profiles with defined limits and target values
✅ Automatic data storage per material; new measurements supplement existing profiles
✅ Real-time data acquisition from connected instruments
✅ Generation of trend charts including statistical analyses
✅ Printable results organized by material
Ensure precise monitoring of weight and volume changes with detailed documentation and clear trend visualizations.
Software for Arrhenius Plot EC 15
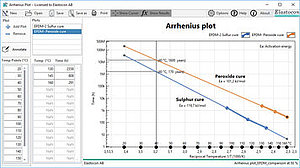
EC 15 Arrhenius plots can be used to evaluate results, for example, from stress relaxation tests, and to make life time estimations. EC 15 lets you quickly plot the graphs and display the results.
Arrhenius Plots – Simplified and Modernized
Effortlessly create and customize Arrhenius plots using the intuitive EC 15 software. Gain full control by selecting temperature points, adjusting axis values, changing colors, comparing different materials or batches, and adding personalized annotations. Easily toggle the activation energy display on or off to tailor your analysis.
Quick and Easy Learning:
Explore brief, easy-to-follow video tutorials (silent) directly within the software to quickly become proficient with its features.
Flexible Export Options:
After creating your ideal plot, conveniently export or share using:
✅ Clipboard copying
✅ Image saving
✅ PDF export or direct printing
EC 15 makes generating Arrhenius plots after stress relaxation tests simpler and more intuitive than ever before.
Software for Low Temperature Compression Set EC 10
The EC 10 software for low temperature compression set, LTCS, monitors the temperature during the test time and records the recovery when the test piece is released.
EC 10 Software – Intuitive Operation and Flexible Usage
The EC 10 software is divided into three clear sections, easily accessible via a dropdown menu in the main window:
1. Configuration
In the Configuration view, you can:
✅ Adjust hardware configuration (e.g., change communication address)
✅ Update connection to hardware
✅ Display sensor properties
✅ Organize compression rigs into groups
2. Log
The Log view enables you to:
✅ Prepare and set up all tests
✅ Log events from the compression rigs
✅ Use groups previously created in the Configuration view
3. Presentation
In the Presentation view, you can:
✅ Open and examine recordings in detail
✅ Display results at defined intervals (e.g., 30 seconds, 30 minutes)
✅ Graphically present compression set results over time
✅ Perform printouts, exports, and comprehensive evaluations
Basic Software and Licensing
The EC 10 software consists of two parts for maximum flexibility:
✅ EC 10 – Basic software module
✅ EC 10-x License – Purchase licenses per rig (up to 8 rigs)
This provides a tailored system that can easily be expanded as your requirements change.
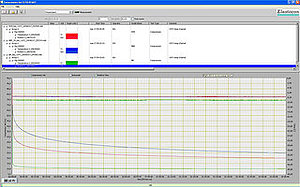
Software Stress Relaxation EC 05
The stress relaxation software EC 05 performs and evaluates stress relaxation tests and supports both ISO and ASTM standards.
EC 05 Software – Intuitive Operation and Comprehensive Features
Experience the simplicity and powerful functionality of the EC 05 software, providing clear structure and intuitive operation for stress relaxation testing:
Key Features
Easily manage your tests:
✅ Edit test setups and monitor test status
✅ Evaluate stress relaxation
✅ Automatically increase the logging time intervals
✅ Display results as absolute force (N), F/F0, R(t), or F/F(t0)
✅ Calculate median values for double or triple test samples
✅ Generate comprehensive test reports
✅ Compensate for load cell deformation
✅ Switch seamlessly between absolute and relative time
✅ View result graphs in linear or logarithmic time scale
✅ Quickly zero the force reading
✅ Easily set the F0 value
✅ Define end conditions based on F/F0 or time
Clear Visualization
✅ Easily explore and interpret recorded data
✅ Display results clearly with customizable intervals
✅ Generate intuitive graphs for comprehensive analysis
✅ Conveniently export or print detailed reports
Optimize your testing procedures with EC 05—user-friendly software built for precision, flexibility, and efficiency.
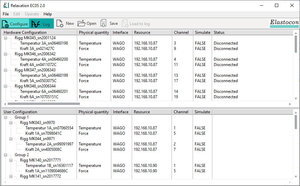
Configuration View – Clearly Structured and Efficient
In the configuration view, users can easily combine one, two, or three test rigs into a group. The data for each group is automatically stored in a separate file. Additionally, the software automatically calculates the median results of the test rigs within the group.
Key Benefits:
✅ Flexible grouping of up to three test rigs
✅ Automatic storage of group data
✅ Calculation of median values for precise evaluation
Use the configuration view to efficiently manage your test rigs and obtain meaningful results.
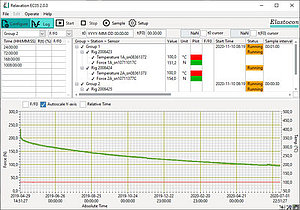
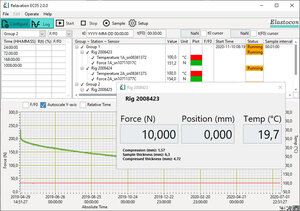
Log View – Streamlined and User-Friendly
In the log view, users define the logging details, set the evaluation points, including the timing for t0 and F0, and initiate the test.
Key Features:
✅ Easy setup of logging details
✅ Flexible setting of evaluation points (t0 and F0)
✅ Quick initiation of tests
Use the log view for straightforward test management and precise monitoring of your test procedures.
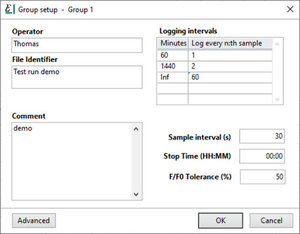
Group Setup – Clear and Flexible
In the "Group Setup" window, you define the filename for the result file, adjust the logging intervals as needed, and set the end conditions based on time, F/F0, or a combination of both.
Key Features:
✅ Define the result file name
✅ Customizable logging intervals
✅ Flexible definition of end conditions (time, F/F0, or a combination)
Use the group setup feature for flexible and efficient test planning and execution.
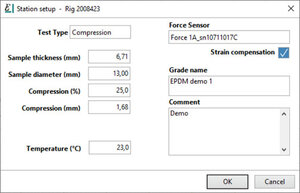
Station Setup – Simple and Precise
In the "Station Setup" window, users define the type of test (compression or tension) and specify the dimensions of the specimen.
Key Features:
✅ Select the test type: compression or tension
✅ Enter specimen dimensions quickly and accurately
Streamline your test setup with a clear and user-friendly interface.
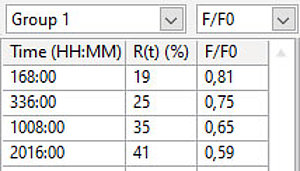
Evaluation Points – Targeted Analysis
In the "Evaluation Points" table, you can define specific time points at which the software automatically calculates the relaxation percentage and the F/F0 ratio.
Key Features:
✅ Flexible selection of evaluation time points (e.g., 30 s, 10 min, 24 h)
✅ Automatic calculation of relaxation percentage and F/F0
✅ Clearly structured result display for targeted analysis
Use evaluation points for precise comparability and well-founded result interpretation.
Core Software and Licensing – Scalable and Tailored to Your Needs
The software is purchased in two parts to maximize flexibility for custom system configurations:
✅ EC 05 – The base module of the software
✅ EC 05-x – Licensing module (per rig)
✅ Volume-based pricing tiers: 8, 16, and 32 rigs
✅ Scalable solution that grows with your testing needs
EC 05 Viewer Software – Easy Analysis and Reporting
The Relaxation Viewer is part of EC 05 Relaxation and is used to analyze test results and generate test reports.
Additional viewer licenses can be purchased separately, allowing the software to be installed on a separate office computer for independent evaluation.
Key Features:
✅ Open and compare multiple files simultaneously
✅ Generate reports for printing or export
✅ Edit evaluation points
✅ Analyze according to ISO 3384 Method B
✅ Export measurement data
The EC 05 Viewer Software enables convenient, remote evaluation—efficient, clear, and professional.
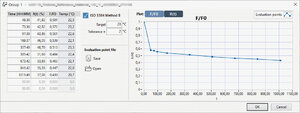
Evaluation Point Editor – Flexible and Powerful
The Evaluation Point Editor allows users to add, remove, and modify evaluation points as needed.
Key Features:
✅ Add, delete, or change evaluation points easily
✅ Analyze via F/F0 or R(t) in accordance with ISO 3384 Method B, including cycle temperatures
✅ Save evaluation points to a file for reuse
✅ Load evaluation points into other protocol files for consistent analysis
This editor ensures flexible and efficient handling of evaluation data across multiple tests and reports.
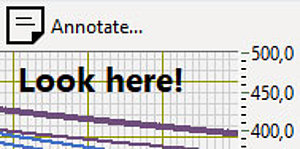
Add Annotations
Annotations can be added directly to the chart. They are included in the report and help ensure a structured and comprehensible presentation of the content.
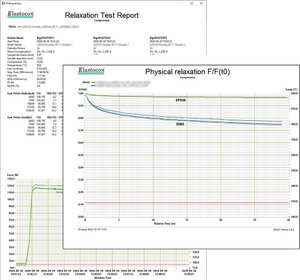
Display Options: F/F₀, R(t), and F/F(t₀)
Force can be displayed in different formats: F/F₀, R(t), or F/F(t₀).
The F/F(t₀) option shows the ratio of force over time between the reference point t₀ and F₀, allowing for a detailed analysis of dynamic behavior.
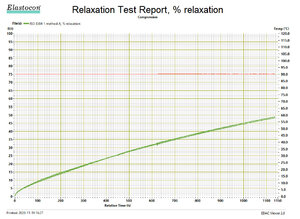
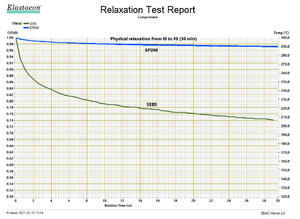
Creating Reports
Two types of reports are available:
✅Detailed Report – includes comprehensive information about the stations and evaluation point calculations
✅Chart Report – displays only the chart (see image on the previous page)
Customizable Options:
✅ Add annotations directly to the report
✅ View and edit drawing names
✅ Adjust the appearance of the drawing and the chart scale
✅ Set the time axis to relative, absolute, or logarithmic scale
The final report can be easily printed or saved as an image file.
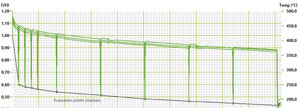
Print Evaluation Data as Chart
Evaluation points can be displayed graphically in the report – clear and easy to interpret.
✅Flexible Print Selection:
Choose exactly what you want to print.
You can select multiple files, groups, or stations – in any combination – for inclusion in the report printout.
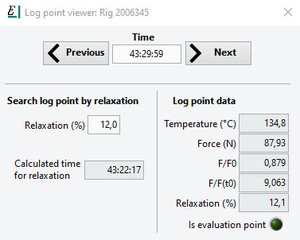
Viewing Log Point Details
Detailed information about log points can be displayed and easily searched.
✅Filter Functions:
Search specifically for certain relaxation levels or browse the complete list of log points for precise analysis.
Customize Report
Tailor the report to meet your specific needs:
✅ Edit the report header
✅ Change file names
✅ Add your own logo to the report
Create professional reports that match your intended purpose and branding.
Edit Group and Transmitter Settings
Manage and customize key information related to your measurement data:
✅ Edit the note name, operator, and comment
✅ Enable or disable strain compensation per station or group
✅Export data: Measurement data can be exported as a well-formatted text file – ideal for use in Excel or database systems
Secure Your Long-Term Logging
For reliable long-term data logging, we strongly recommend securing your computer’s power supply using a double-conversion UPS (Uninterruptible Power Supply).
This helps to minimize the risk of electrical disturbances and power failures.
✅Elastocon offers the ED 06 UPS, a robust solution to ensure uninterrupted operation of your logging instruments.